Exploring the Power of Kusto Query Language in Azure Application Insights
Posted
Last updated
2 min read

Introduction
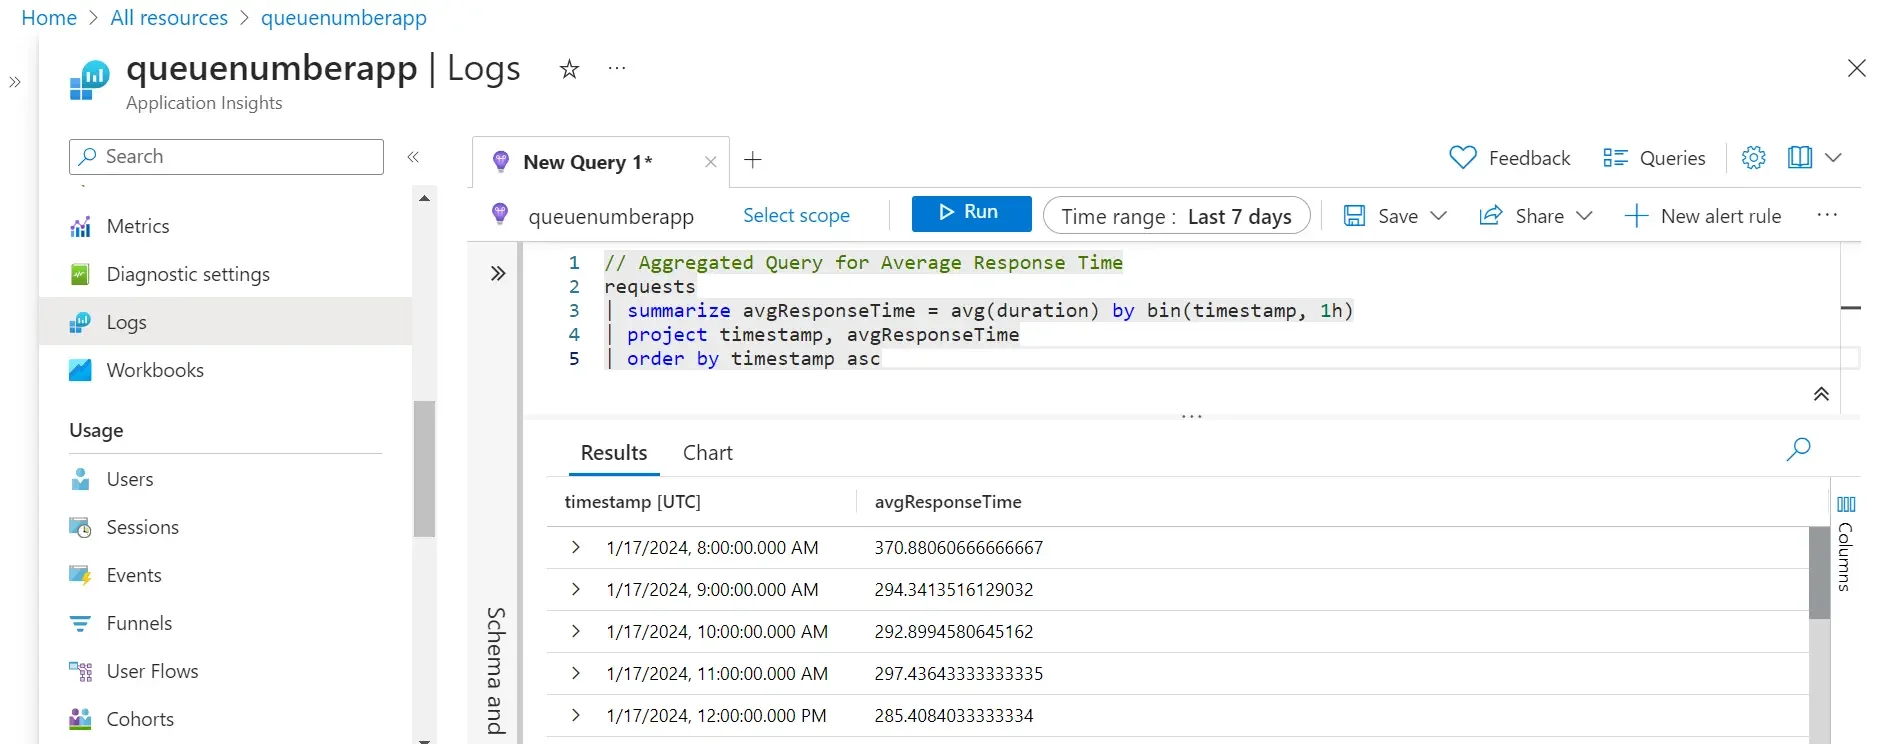
In this blog post, we will explore a few samples of Kusto queries. The purpose is to become familiar with the appearance of queries and how to test them in the Azure portal. In the Azure portal, navigate to your Application Insights resource, click on the "Logs" menu item in the left menu, and you'll find the query editor (as shown in the blog post's cover image). Feel free to follow along, copy the queries, and test them in the Azure portal. You can also experiment with the drop-down to modify the time range for the queries.
Simple Code Samples
Let's go through a few code samples. Application Insights offers several built-in tables with data that you can query and even join. In this post's samples, we will use the "requests" table for a few simple queries. For more information about the data model in Application Insights and the available data, refer to this link.
Example 1: Basic Query:
The purpose of this query is to retrieve the count of requests grouped by operation name. Target the "requests" table and use the built-in operators "count()" and "summarize". Read more here and here. Find more available operators there as well.
requests
| summarize requestCount = count() by operation_Name
| order by requestCount desc
Example 2: Filtering Data
This query involves filtering data based on the condition that the "success" property is set to false, meaning this query retrieves a list of all requests that resulted in a non-successful response.
requests
| where success == "False"
| project timestamp, operation_Name, resultCode
| order by timestamp desc
Example 3: Aggregation and Time Windows
This query involves aggregating data over a time window. It uses the "avg" operator, which calculates the average value for a certain property in a data collection. Both of these operators are used with the "summarize" operator, which produces a table with aggregated data based on the query. This query calculates the average response time for a request over 1-hour time windows (see the ... by bin(timestamp, 1h)).
requests
| summarize avgResponseTime = avg(duration) by bin(timestamp, 1h)
| project timestamp, avgResponseTime
| order by timestamp asc
Conclusion
That's it for now! Thanks for joining me. Familiarize yourself with the various tables available in Application Insights. In future posts, we will explore even more advanced examples by calculating trends and comparing with previous time periods. Thanks!